The following analysis is derived using data available from various sources as listed on my “References/Data Sources” page.
See my “Methodology” page for a description of the methodology used.
This current version was updated 1/22/20.
If anyone has any issue with the data or analysis, I’d welcome that discussion – I’d like to make sure my data is as accurate as possible, if you see something, say something! You’re welcome to email me at info@sandiegoschools.net.
Analysis
Data for this analysis was from a period starting in 2013 and ending in 2019, based on the latest pay data available from the sources listed.
I use this period for a specific reason. In 2012 the people of California recognized that cuts made as a result of the Great Recession had gone too deep into education, and voted to increase taxes to fund better education for our kids, via Proposition 30.
One purpose of this examination is to take an objective look at how that additional funding has been spent.
San Diego County
Funding
During this period funding for schools (per the California Department of Education’s “Annual Financial Data” reporting, commonly called “SACS Data”) has increased dramatically.
Education funding in the county is up $4,479/student, from $9,512 in 2013 to $13,991 in 2019. A total increase of 47.08%, or 6.64% per year.
This has resulted in a total rise in revenue in this county of $1.653 billion dollars per year.
During this time the inflation rate in the county (per the California Department of Industrial Relations) has averaged 2.36%, meaning school funding in this county has gone up 2.81 times faster than inflation.
Compensation
As a baseline for comparison to compensation levels normal in private industry in this area, I’m using statistics for private industry as reported by the US Bureau of Labor Statistics (USBLS) and the US Census Bureau (USCB).
Wage and Benefit Compensation
According to the USBLS, in 2019 the average pay of private industry workers in the county was $62,674/year.
For the period 2013-2019 the BLS Compound Annual Growth Rate (CAGR) of wages was 2.58% per year.
Median Wages by Educational Attainment
To determine comparable wages by educational attainment, I use USCB numbers, which are reported as median values.
According to the California Department of Education’s DataQuest reporting system (“Staff Education Report – District Level”) for 2018-2019, 31.20% of SDUSD teachers have a bachelor’s degree, 68.80% have more advanced degrees.
If we adjust the USCB numbers to weight them to the same mix, the average SD County resident with educational attainment similar to the SDUSD teacher workforce made $81,387 in 2019.
Benefits
Education employees receive significantly more in benefit compensation than private employees, so a comparison of total compensation needs to include this. We will call this the “benefit advantage” here.
Healthcare premiums, for both the employee and their family, are usually 100% paid by the district in California.
Data shows the average portion of healthcare premiums paid by Californians in private industry in 2019 to be $4,648.
Retirement plans are usually “defined benefit” (i.e. pensions) in school districts. That involves periodic contributions by both employee and the employer (the district) to that plan.
For comparison, in private industry Vanguard (the world’s largest retirement plan administrator) has found the average contribution by private companies to retirement plans on behalf of their employees in 2019 was 4.0%. Typically the employee is required to contribute an equal amount to obtain that match.
In private industry both employer and employee are also required to contribute 6.2% to social security.
Total annual retirement contributions would be: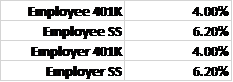
For a total annual retirement contribution amount for private industry of 20.40% of employee pay, of which 10.20% of that is compensation provided by the employer.
California’s public employees are usually exempt from Social Security withholding so nothing is deducted from the employee’s pay and no employer contributions are required.
CalPERS and CalSTRS (the pension plans for support and certificated staff respectively) have different employer contribution rates.
District contributions are broken down by “Normal” (mandated annual contributions), “State:” contributions (which come from the General Fund, not the local district), “Supplemental Benefit Maintenance Account”, and (SBMA) contributions – which funds future inflation adjustment increases to pension payments.
In 2019 these were:
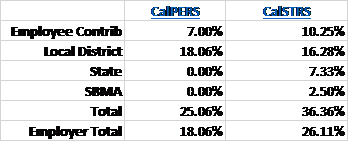
Since private industry provides compensation of 10.40% for these benefits, this means during this year employees covered under CalPERS were given an extra 7.86% in compensation and CalSTRS members an additional 15.91% above and beyond what is normally contributed by the company in private industry.
For the purposes of this examination, I call that the “benefit advantage”.
San Diego Unified
Funding
According to the state’s school district budget (SACS) data, in SDUSD during our examination period funding has risen from $9,973/ADA in 2013 to $13,991/ADA in 2019.
This has resulted in a total increase in revenue in this district of $4,635/student or a total of $364,344,079 dollars per year, a rise of 46.47% or 6.57%/year.
During this time the inflation rate in the county (per the CDIR) has averaged 2.36%, meaning school funding has gone up 2.78 times faster than inflation.
Compensation
Using public pay data reported by San Diego Unified, obtained through California Public Records Act requests and posted on the Transparent California website, we find:
All Full-Time Employees
In 2019, the average total pay of all 9628 full-time SDUSD employees was $75,415/year.
This is $12,741 or 20.33% more than the average county resident. This is pay only.
Including the cost of benefits, the average actual total compensation of this group was $103,508/year.
To include the benefit advantage as well in the calculation, the district’s employee base is about 58.39% certificated (meaning CalSTRS), applying this to the employee population as a whole gives a blended retirement advantage of about 12.18%.
Adding the healthcare advantage of $4,648 to the retirement advantage means SDUSD employees receive an additional $13,833/year in benefit compensation not given to private employees, making their adjusted comparable average rate of compensation $89,248/year.
This is $22.316 or 42.03% more than the average county resident.
Pay Increase Rate:
To determine the rate of pay increase for employees, we look at longitudinal data (data on the same employees over this time). For more on how this works and why it’s important, see our Methodology page.
In 2019, we find 6409 full-time employees who have been with the district since 2013. This cohort of continuing employees has had their average total pay increase by $19,300/year (or 31.60%), with a Compound Annual Growth Rate (CAGR) of 4.68%.
This average growth rate is 1.81 times greater than the rate of growth for the average county resident (of 2.58%) during this period.
Median total pay for this group increased with a CAGR of 5.43%
Administrative Employees
In 2019, the average total pay for 306 full-time administrative employees was $121,922/year. Including benefits, average total compensation was $158,293/year.
The median total pay for such employees was $128,035/year and $164,030/year respectively.
With benefit advantage (CalPERS and HW) the average comparable pay is $141,497/year, median comparable $145,919/year.
In 2019, we find 214 full-time administrative employees who have been with the district since 2013. These continuing employees had an average total pay of $125,039/ year, with average total compensation (including benefits) of $162,077/ year.
Median total pay for such employees was $128,035/ year, with total compensation $166,075/ year.
Since 2013, this cohort of employees has had their average total pay increase by $39,759/ year (or 46,62%), with CAGR of 6.59%.
This growth rate is 2.55 times greater than the rate of growth for the average county resident (2.58%) during this period.
Median total pay for this group increased with a CAGR of 7.26%.
Certificated Employees
In 2019, the average total pay for 5166 full-time certificated employees was $85,399/year. Including benefits, average total compensation was $115,273/year.
The median total pay for such employees was $89,241/year and $119,576/year respectively.
With benefit advantage (CalSTRS and HW) the average comparable pay is $100,448/year, median comparable $104,086/year.
In 2019, we find 3506 full-time certificated employees who have been with the district since 2013. These continuing employees had an average total pay of $90,895/year, with average total compensation (including benefits) of $122,373/year. The median total pay for such employees is $95,068/year, with total compensation $124,632/year.
Since 2013, this cohort of employees has had their average total pay increase by $22,587/year (or 33.07%), with CAGR of 4.88%.
This growth rate is 1.89 times greater than the wage growth for the average county resident during this period.
Median total pay for this group increased with a CAGR of 5.50%.
In the Certificated group, the case is often made that teachers should be paid commensurate with their educational attainment, based on what they could be making with the same education if they were working in private industry.
Comparing SDUSD certificated employees to the median for county residents with comparable educational attainment, we see that the 2019 SDUSD certificated full-time median total pay (of $89,241/year) is $7,854/year (9.65%) higher than the median for comparably educated SD county residents of $81,387/year.
Adding the benefit advantage to this makes for a comparable median total compensation of $104,086/year, which is $14,413/year (17.71%) more than comparably educated county residents.
If we assume a 30 year career, this difference could amount to a minimum (not counting wage growth) total of $432,380 in additional pay.
Budget Impact
As we saw above in “Funding”, despite revenue growth of 46.47% at a rate over almost 3 times faster than inflation, the district is having financial difficulties.
Wage growth at higher rates than average for residents of the area, combined with final pay rates also significantly higher than comparable employees has substantial budgetary impact. Particularly in K-12 education, where the cost of pay and benefits is often 80-90% of a districts’ budget.
To examine the budgetary impact of this higher growth rate we can look at just the cohort of employees who have been with the district since 2013 (not the entire employee base of the district, just a sub-set), we see if this group’s total pay growth had matched the average county resident, the net budgetary impact (for this group only) would have been a reduction in annual total pay cost to the district of $58,928,469 per year.
This understates that number as well. Pension contributions are determined as a percentage of pay, higher pay creates higher pension contribution obligations, increasing the financial impact on money available to the district to fund programs and services for our kids.
These calculations are made from verifiable numbers, drawn from reliable and public sources of data, to inform our debate on the financial difficulties of our schools with real data.
You are welcome to use this in any way to draw your own conclusions.
An online version of this is available at:
Some of the data files that were acquired and prepared in this are at:
https://drive.google.com/drive/folders/1hl-oORsakNmGYpeTAYJZLZdZphbzr0XA?usp=sharing